|
|
You are here: Wiki>SensorWeb Web>SensorWorld>VisualizationComponent (28 Aug 2008, BirteLue)Edit Attach
Visualization Component
Implementation
The visualization is tight-knit to the phenomenon simulation, therefore both are started together. Basically the Sensor World Vis Controller draws images of the value raster of the composed phenomenon in one layer in specified time steps. To track the movement of the sensors a Sensor Position Observer is started at the same time and listens to the position messages. These postions are saved as geometries in a list and are added as the second layer to the drawed image. All images are saved on the hard disk and will be added to a quick time video after the visualization runtime.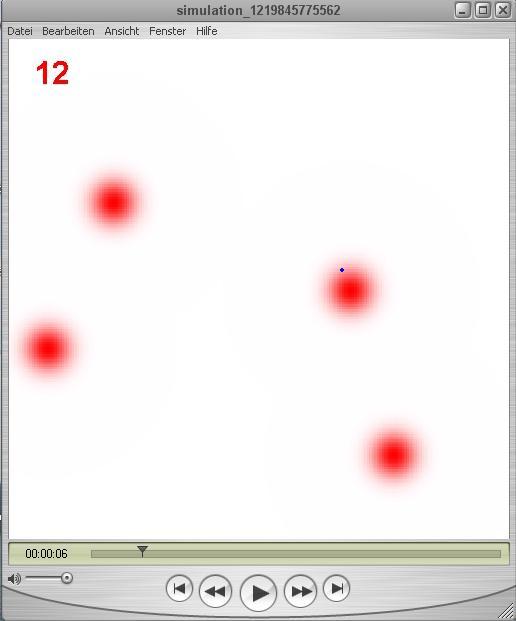
Edit | Attach | Print version | History: r5 < r4 < r3 < r2 | Backlinks | View wiki text | Edit wiki text | More topic actions
Topic revision: r4 - 28 Aug 2008, BirteLue
- Toolbox
-
 Users
Users
-
 Index
Index
-
 Search
-
 Changes
-
 Notifications
-
 RSS Feed
-
 Preferences
- Webs
-
 AI_GEOSTATS
- Documentation
- GEONETCAST
- Geoprocessing
- Geostatistics
- Metadata
- Projects
- Sandbox
- Security
- Semantics
- SensorWeb
- System
- V3d
- Categories
Legal Notice | Privacy Statement
 Copyright © by the contributing authors. All material on this collaboration platform is the property of the contributing authors.
Ideas, requests, problems regarding Wiki? Send feedback
Ideas, requests, problems regarding Wiki? Send feedback